AWS Security Blog
Detecting multi-stage attacks on AWS: A guide to cross-service signal correlation
A single alert from one security service tells you something happened. Read that signal alongside activity from other services and your own business context, and you will know whether what happened is part of a multi-stage attack.
Consider a short sequence. An identity calls GetCallerIdentity from a source address it hasn’t previously used. Within minutes, that same identity runs a burst of List and Describe calls across several services, and some of them fail with AccessDenied. Soon after, a large volume of data leaves your environment toward a domain that was registered last week. Amazon GuardDuty might already flag pieces of this, such as the reconnaissance from an unfamiliar source, through finding types like Recon:IAMUser/* or Discovery:S3/*. What you gain from correlating the pieces yourself is a single view of the sequence, tied to your own business context, so you can act on the whole rather than triaging findings one at a time.
This post is for security engineers and security operations teams who run Amazon Web Services (AWS) detection services and want to catch patterns specific to their environment. You will see how AWS detection and your business context fit together, and how to build correlations that use that context. The examples run in Amazon CloudWatch Logs Insights so you can try them today, and the closing section describes how to grow them into an automated pipeline. The walkthrough later in this post lists the prerequisites for these queries.
Start with AWS detection services
Begin with the AWS detection services. They cover the threats common across customers, and everything in this post is built on them.
- Amazon GuardDuty analyzes activity across AWS CloudTrail, Amazon Virtual Private Cloud (Amazon VPC) Flow Logs, DNS query logs, Amazon Simple Storage Service (Amazon S3) data events, and more and it produces high confidence findings out of the box.
- Amazon Detective (a security investigation service that visualizes relationships between resources and findings) lets you investigate findings with graph-based context across services and accounts.
- AWS Security Hub aggregates security findings into a single prioritized dashboard.
- Amazon Security Lake centralizes security data into a purpose-built data lake, stored in the Open Cybersecurity Schema Framework (OCSF) format for long-term analysis.
- Amazon Inspector (a vulnerability management service that scans workloads for software vulnerabilities) correlates vulnerability data with workload context.
Turn these on and tune them before you build anything custom. Tuning means adjusting sensitivity to reduce false positives for your environment, choosing which data sources each service monitors, and suppressing findings for known-good patterns.
GuardDuty correlates multi-stage attacks for you
Before you build anything by hand, see what GuardDuty already does for you. Amazon GuardDuty Extended Threat Detection correlates signals across multiple data sources including AWS CloudTrail, Amazon S3 data events, runtime monitoring, Amazon Elastic Kubernetes Service (Amazon EKS) audit logs, and more, then raises a single critical severity attack sequence finding when it spots a multi-stage pattern. It recognizes sequences such as credential compromise followed by data exfiltration, maps them to MITRE ATT&CK tactics, and attaches a timeline and remediation guidance. If you have GuardDuty enabled today, then GuardDuty Extended Threat Detection is already enabled by default and needs no queries from you. For details on how GuardDuty charges apply, see Amazon GuardDuty pricing.
The credential compromise sequence in the opening example is the kind of universal pattern GuardDuty Extended Threat Detection is built to catch, so rely on it for those. Attack sequence findings show up in the GuardDuty console next to your other findings, and they route to Security Hub and your response workflows the same way.
GuardDuty handles the threats that look the same in every account. What it doesn’t have is the context that makes a given action suspicious in your account. That’s what you provide.
Add your business context
Business context is what only you know about your environment: which buckets hold sensitive data, which principals have a reason to touch which resources, which role chains your policy permits, and when your production change windows open. GuardDuty Extended Threat Detection learns from patterns common across customers, but it can’t answer these environment-specific questions. Express them as correlations and you add a detection layer tuned to your environment. Each of the following four patterns turns one of these facts into a query.
Run these queries in the AWS Management Console for CloudWatch by choosing Logs, then Logs Insights, using the CloudWatch Logs Insights query language. Most read CloudTrail events from a CloudWatch Logs log group that your trail delivers to. If your trail writes only to Amazon S3, add CloudWatch Logs delivery on the trail, or run equivalent queries in Amazon Athena (a serverless query service for analyzing data in Amazon S3 using SQL).
Note: The queries and code in this post use placeholder values. Replace them with your own before running:
your-sensitive-bucket(your S3 bucket name),your-key-id(your AWS KMS key ID),region(your AWS Region, such as us-east-1),account-id(your 12-digit AWS account ID), andaws-cloudtrail-logs-my-trail(your CloudTrail log group name).
A note on multi-account environments. In AWS Organizations, an organization trail delivers every account’s events to one log group, so these queries work as-is but return cross-account results. Filter by recipientAccountId for account-scoped views. Without an organization trail, run queries per account or use Amazon Security Lake as a central query surface.
The attack chain mapped to AWS services
Multi-stage attacks move through five phases, and each phase leaves a signal in a different service. These signals surface across three log sources: CloudTrail, which records API activity in your account; Amazon VPC Flow Logs, which capture network connection metadata; and Amazon Route 53 Resolver query logs, which record DNS queries from your VPCs.
- Initial access – Stolen credentials reach your environment. CloudTrail records
GetCallerIdentity,GetSessionToken, orAssumeRolefrom an unfamiliar source. - Discovery – The threat actor enumerates with
List,Describe, andGetcalls, often triggeringAccessDeniedresponses. - Privilege escalation – The threat actor chains roles or edits policies. CloudTrail records
AssumeRolesequences,PutRolePolicy, orCreateAccessKey. - Lateral movement – The threat actor moves across accounts or AWS Regions, assuming roles and creating resources in unfamiliar places.
- Exfiltration – Data leaves through
GetObjectcalls at scale, large outbound transfers in VPC Flow Logs, and DNS queries in Route 53 Resolver query logs to recently registered domains.
Figure 1 shows the five attack phases mapped to the AWS log source that records each one.
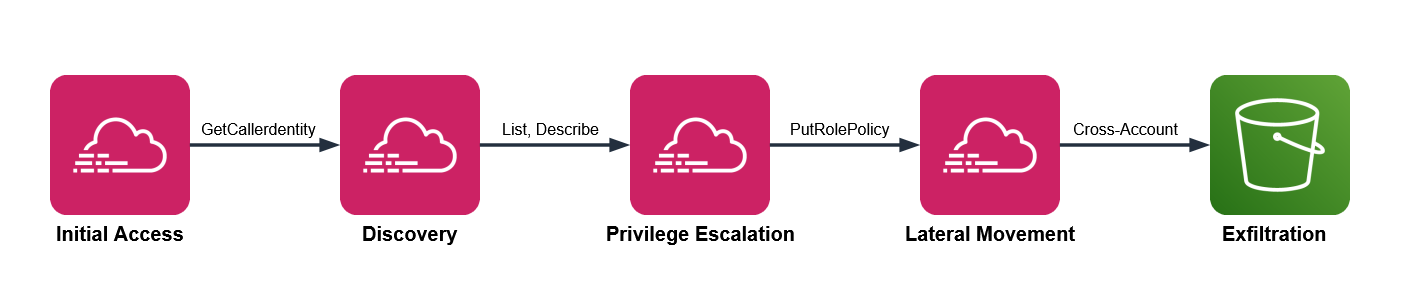
Figure 1: Attack chain mapped to AWS services
GuardDuty Extended Threat Detection watches this chain for universal patterns. The four patterns that follow add the dimension you supply: your business context.
Pattern one: Sensitive data access by an unexpected principal
Your data classification and access norms drive this detection. One bucket holds customer records, another holds public web assets, and you know which principals have a reason to read the customer records, which are sensitive. Encode that knowledge and an ordinary looking read turns into something worth chasing.
Three signals converge here. CloudTrail shows GetObject at volume on a bucket you’ve classified as sensitive. The principal isn’t on your list of expected readers for that bucket. And VPC Flow Logs show a large outbound transfer from the same source in the same window, while DNS query logs show a recently registered destination domain, which together increase your confidence that there’s a potential threat.
CloudTrail management events don’t record GetObject. You must turn on CloudTrail data events for the buckets you care about to capture GetObject. Many teams miss GetObject because data events weren’t enabled on the relevant buckets.
This query shows bulk reads on a sensitive bucket, grouped by principal. Run it in CloudWatch Logs Insights with your CloudTrail log group selected.
The threshold of 100 is a placeholder. Run the query over a week of normal activity, find the ninety-fifth percentile read count for that bucket, and set the threshold above it. Then check each principal the query returns against your expected reader list. A principal that isn’t on the list, reading at volume, is the result to investigate.
To corroborate, look for a matching outbound transfer. Switch the log group selector to your VPC Flow Logs log group and run this.
The Amazon S3 query returns a principal, and the Flow Logs query works on IP addresses, so you translate one into the other. The worked example later in this post covers that translation in full.
Picture an analytics role that reads a reporting bucket all day. One afternoon, it reads a thousand objects from your customer records bucket instead. GuardDuty stays quiet, because an authenticated role making valid GetObject calls isn’t suspicious anywhere else. Your query flags it, because that role isn’t on the expected reader list for that bucket. The classification you applied is what turns silence into a signal.
Figure 2 shows a bulk read from a sensitive bucket in CloudTrail, a large outbound transfer in VPC Flow Logs, and a young domain resolution in Route 53 Resolver logs.
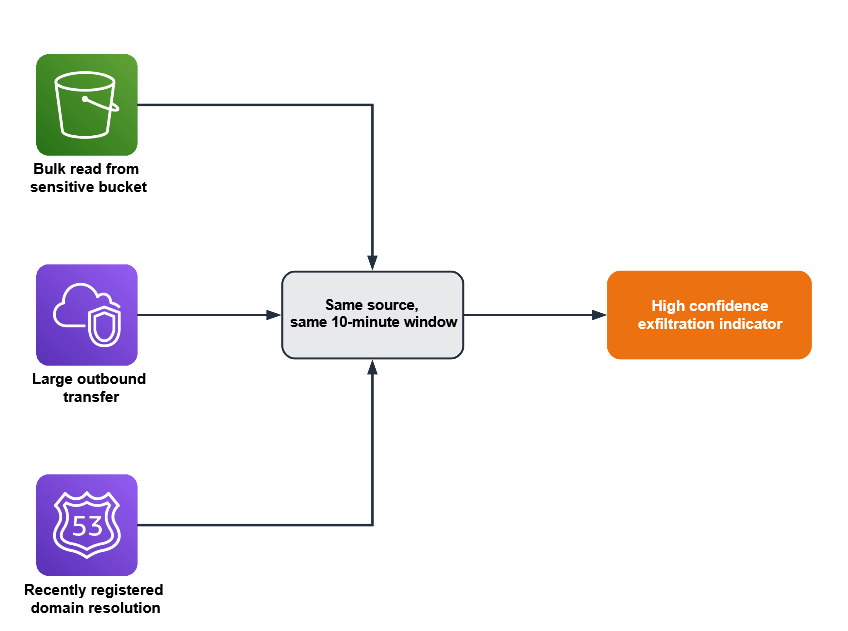
Figure 2: Three signals converging within a single time window to indicate exfiltration
Pattern two: A role chain that crosses your access policy
Picture a deployment that assumes one role to build, then a second to release. For one principal, that two-hop AssumeRole chain is routine; for a different principal it’s a policy violation. This pattern relies on your trust topology—the chains your organization permits—so put that knowledge in the query.
This pattern needs three conditions:
- CloudTrail shows several
AssumeRolecalls from the same source inside a short window - The chain ends in a sensitive action such as
CreateAccessKey,PutRolePolicy, orAttachUserPolicy - The starting identity isn’t one your policy expects to run that chain
In CloudWatch Logs Insights, select your CloudTrail log group and run this query, which surfaces chains of two or more hops.
Two hops is the minimum for a chain; raise the count if your environment chains roles often. Your deployment pipeline probably assumes several roles an hour, as do AWS service principals such as AWS Security Hub. Exclude the identities you expect to see assuming multiple roles, including your pipeline role and known AWS service principals. What’s left is the set to investigate, such as a person assuming several roles at an odd hour and ending in a new access key. Treat that distinction as data: list the identities and actions you consider normal, and review the chains that fall outside the list.
Pattern three: An encryption key used outside its owning workload
Resource ownership is the signal here. A given AWS Key Management Service (AWS KMS) key creates and controls the encryption keys for a workload, and a single key should serve a single workload, such as a payments service. A Decrypt call against it is a valid, authorized API action, so nothing about the call itself looks wrong. The ownership rule you set is what makes another principal’s use of the key worth a second look.
This pattern applies only to customer-managed keys scoped to one workload. It doesn’t apply to AWS-managed keys (alias/aws/*) or to customer-managed keys intentionally shared across services. Confirm single-workload intent from the key policy’s Principal block before deploying this rule.
Two conditions indicate misuse:
- CloudTrail shows
DecryptorGenerateDataKeycalls on a key that’s tied to one workload - The calling principal isn’t the role that owns that workload
Against your CloudTrail log group, run this query to list the principals that called a specific key.
Compare what comes back against the one workload role you expect. A principal you don’t recognize on that key is the signal. Because key misuse is an early move in data theft, this correlation catches activity that only your ownership knowledge can flag.
Consider a key that wraps your payments database. The payments service role calls it in normal operation, and nothing else should. If a developer role or a freshly created role runs Decrypt against it, the call succeeds and reads as ordinary in isolation. The reason it matters is the ownership rule you hold in your head and now state in this query.
Pattern four: A privileged action outside your change window
Start with the query, then read what it means.
Run it against your CloudTrail log group, scoped to your off-hours window when you schedule it, so it returns only activity outside the change window. Your change process defines what normal looks like here: production security and identity changes flow through a pipeline during defined hours, run by a known actor. A console-driven policy change at 2:00 AM, made by a person rather than the pipeline, doesn’t fit those expectations. The signal is a sensitive change such as PutRolePolicy or AuthorizeSecurityGroupIngress, made outside the window, by a person rather than your pipeline role.
Exclude the actors you expect, such as your deployment pipeline role, your patch automation role, and AWS service principals like AWS CloudFormation and AWS Systems Manager. What remains is privileged change made outside your process, which is both what an attacker does to establish persistence and what your own change discipline says shouldn’t happen.
Your pipeline might open security group rules during a deployment every weekday afternoon. A person opening a security group rule at midnight on a weekend is the same API call carrying a very different meaning. The schedule and the actor, both facts you define, are what separate the two.
Build your first correlation rule
The following walkthrough uses pattern one as a complete example. The other three patterns follow the same design with their own queries.
Prerequisites
These prerequisites feed the queries in this walkthrough. Confirm each one before you start:
- A CloudTrail trail logging management events to a CloudWatch Logs log group
- CloudTrail data events enabled for your sensitive S3 buckets
- GuardDuty enabled, with its protection plans and Extended Threat Detection
- VPC Flow Logs on for your production VPCs
- Amazon Route 53 Resolver query logging on
CloudTrail, GuardDuty, VPC Flow Logs, and Route 53 Resolver query logging provide the raw signals that your correlations connect. Without them, the queries in this post return empty results.
Step 1: Record the bucket and its expected readers
Choose one sensitive bucket to monitor, and write down the principals allowed to read it. Store the list where your automation can reach it, such as a configuration file in version control or an Amazon DynamoDB table (a managed NoSQL database).
This example hardcodes the list for simplicity. In production, load it from a DynamoDB table or Parameter Store so you can update it without redeploying.
Step 2: Baseline before you set a threshold
Run the pattern one query over one week of normal activity. Find the 95th percentile read count for the bucket and use a value greater than that as your alert threshold. This step keeps legitimate high-volume access from generating false positives later.
Set the THRESHOLD_READS environment variable to this value when you configure the function in Step 5.
Step 3: Run the access query
In the CloudWatch console:
- Choose Logs, then choose Logs Insights.
- In the Select log group(s) dropdown, select your CloudTrail log group.
- Set the time range to 3h (the last three hours).
- In the query editor, paste the pattern one query.
- Replace your-sensitive-bucket with your bucket name.
- Choose Run query.
- Review the principals in the results table.
- Compare each principal against your expected reader list from step 1, and flag any that are not on it.
Each result includes a principal that step 4 translates into an IP address.
Step 4: Correlate with network activity
CloudTrail logs actions by AWS Identity and Access Management (IAM) principal, while VPC Flow Logs record traffic by IP address. To connect the two signals, translate the principal into its address.
For a role attached to an Amazon Elastic Compute Cloud (Amazon EC2) instance, the userIdentity.principalId field includes the instance ID after the colon, in the form AROAEXAMPLE:i-1234567890abcdef0. Copy the instance ID and look up its private IP address.
Other compute types differ. A VPC-connected AWS Lambda function sends traffic through elastic network interfaces in your subnets, so correlate on those interface addresses. An Amazon Elastic Container Service (Amazon ECS) task records its network interface in task metadata. For a plain assumed-role session with no instance behind it, the sourceIPAddress field in CloudTrail already holds the caller’s address, so you correlate on it directly.
Run the Flow Logs query from pattern one, filtering srcAddr to that address within 10 minutes of the Amazon S3 read timestamp. A match places the same source behind both the sensitive read and a large external transfer in one window. CloudTrail events reach CloudWatch Logs 5–15 minutes after the API call, so correlate on eventTime rather than query time. Query a wider lookback than your correlation window: for example, look back 30 to 60 minutes but correlate on a 10-minute eventTime window. Steps 3 and 4 are manual validation; step 5 automates them.
Figure 2 shows DNS resolution as a third corroborating signal. This walkthrough implements the CloudTrail and VPC Flow Logs correlation. To add DNS, apply the same run_query() pattern against your Route 53 Resolver query log group.
Step 5: Automate the check
Move the query into a Lambda function (serverless compute that runs your code without a server to manage), send results to a notification channel, and schedule regular runs. Work through the following sub-procedures.
To create the notification channel
- Open the Amazon Simple Notification Service (Amazon SNS) console. Amazon SNS is a managed messaging service that delivers notifications to subscribers.
- In the navigation pane, choose Topics.
- Choose Create topic.
- For Type, select Standard.
- For Name, enter
security-correlation-alerts. - Choose Create topic.
- Note the topic Amazon Resource Name (ARN) at the top of the topic details page. You will use it in the function.
- Choose Create subscription.
- For Protocol, select Email.
- For Endpoint, enter your email address or incident management endpoint.
- Choose Create subscription, then confirm the subscription from the email AWS sends.
To create the EventBridge Scheduler execution role
The schedule needs a role that lets it invoke your function, and its trust policy needs conditions that pin the role to the schedule you own. Without those conditions, another account with access to the scheduler service could theoretically call this role; a class of misuse known as the confused deputy problem.
1. Create a trust policy file named scheduler-trust-policy.json.
2. Create the role, then attach permission to invoke the function. Scope Resource to the specific function ARN so this role can’t invoke anything else.
When you create the function, Lambda automatically creates an execution role. You will attach the permissions this function needs to that role in a later step.
To deploy the correlation function
- Open the Lambda console.
- Choose Create function.
- For Function name, enter
CorrelationFunction. - For Runtime, select the latest Python runtime.
- Choose Create function.
- On the Code tab, replace the default code with the following function, then choose Deploy.
- On the Configuration tab, choose General configuration, then choose Edit. Set Timeout to 5 minutes (300 seconds). CloudWatch Logs Insights queries run asynchronously and can take 30 to 60 seconds against large log groups. Choose Save.
- On the Configuration tab, choose Environment variables, then choose Edit, and add
CLOUDTRAIL_LOG_GROUP,FLOWLOGS_LOG_GROUP,SNS_TOPIC_ARN,SENSITIVE_BUCKET, andTHRESHOLD_READS. - On the Configuration tab, choose Permissions, open the execution role, and attach the following least-privilege policy.
Replace REGION, ACCOUNT-ID, and the log-group names with your values. The ec2:DescribeInstances action doesn’t support resource-level permissions, so Resource: "*" is required for that statement; the other statements are scoped to specific ARNs.
To schedule automated runs
Amazon EventBridge (a serverless event bus that connects applications using events) runs targets on a schedule. Create one from the command line, using the role you made earlier.
Step 6: Add enrichment context (optional)
Enrichment cuts triage time by adding an independent signal, but it isn’t required for the correlation to work. This step adds costs. You pay your geolocation provider for API calls, and the additional Lambda execution time increases your Lambda charges. To add IP geolocation, sign up for a geolocation API, add this function to the code, and call it where the handler resolves an IP.
Inside the handler’s loop, after you resolve ip, append the location to the alert.
Step 7: Scale to additional patterns and accounts
As your library grows, move the logic into automated pipelines with EventBridge, Lambda, and AWS Step Functions (a serverless orchestration service that coordinates multiple services into workflows), and surface correlations next to findings in Security Hub. For cross-service correlation at scale, CloudWatch unified data and telemetry capabilities can convert security and compliance data into the OCSF format and let you query sources such as CloudTrail, VPC Flow Logs, and DNS logs from one interface. Security Lake with Athena is a strong option for long-term analysis. Choose the endpoint that fits your retention and query needs.
Figure 3 shows a correlation pipeline built on AWS services including EventBridge, Lambda, Step Functions, and AWS Security Hub. The pipeline runs from data sources through scheduled queries and enrichment to automated response and centralized visibility.
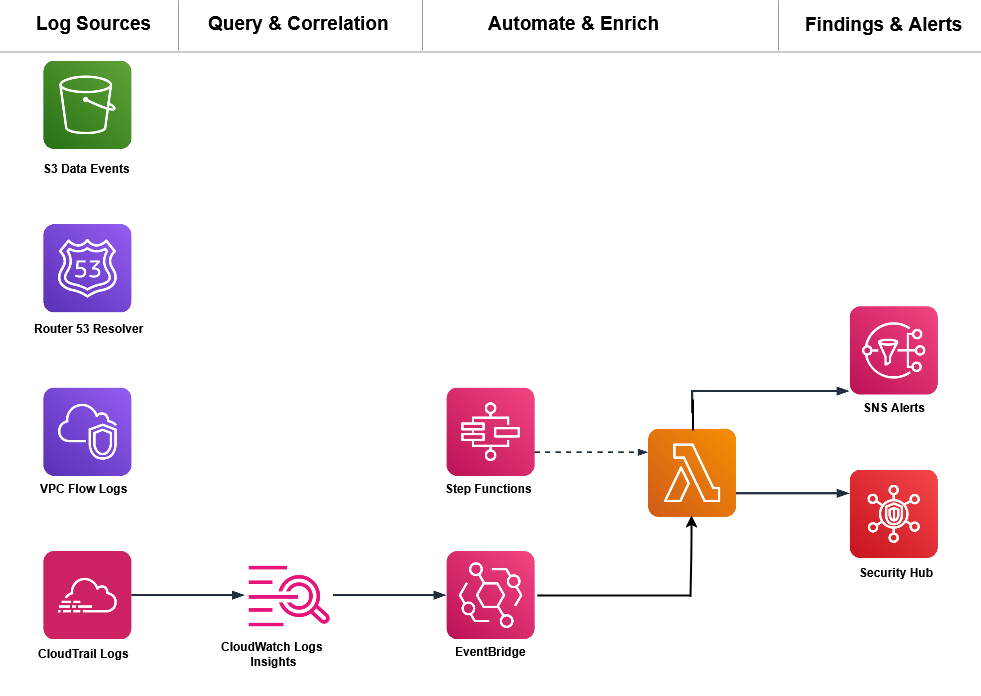
Figure 3: A correlation pipeline built on AWS services
Conclusion
You now have four correlation patterns that layer your business context on top of GuardDuty Extended Threat Detection to catch attacks specific to your environment. A few principles carry across every correlation you build.
- Identity is your primary correlation key: Track the same principal across services.
- Time windows matter, but they depend on the attack: Events minutes apart are usually related for fast, automated sequences; the ten-minute bins here work for that pattern. Slow or manual reconnaissance can stretch across hours or days, so widen the window when the pattern is deliberate rather than automated.
- Context is what you add: Your data classification, access norms, resource ownership, and change windows are signals you bring to detection.
- Start with one rule: A single well-tuned correlation catches more significant activity than a wall of uncorrelated alerts.
GuardDuty Extended Threat Detection handles the multi-stage patterns common across customers. The correlations in this post add the layer that only your business context can supply. Start with one pattern this week, validate it against your own traffic, and add the next pattern after the first proves reliable.
Have you built correlation rules for patterns not covered here? Share your experience in the Comments section below.
Further reading
- Amazon GuardDuty Extended Threat Detection – How GuardDuty automatically correlates multi-stage attack patterns
- CloudWatch Logs Insights query syntax – Reference for the query language used in this post
- Logging data events with AWS CloudTrail – Turn on the Amazon S3 data events pattern you depend on
- Sending CloudTrail events to CloudWatch Logs – Deliver your trail to a log group you can query
- Creating a trail for an organization – Deliver events from every account in AWS Organizations to a single log group
- VPC Flow Logs – Field reference for the network traffic signal
- Amazon Route 53 Resolver query logging – Capture the DNS signal used for corroboration
- MITRE ATT&CK – Industry Framework for attack tactics and techniques
- Open Cybersecurity Schema Framework (OCSF) – The schema Security Lake uses